

At Algorhythm, training is viewed as an essential part of everyone’s development. We think it’s important to keep our colleagues up to date with new standards, technologies, and best practices about how organizations work with Read more…
Category: Data Visualization

BI decision matrix
Over the past years, we have had several trainees at Algorhythm. This is a good opportunity for the students to get to know us better. Miguel Haest’s internship assignment was to compare the strengths and Read more…

Happy birthday to our Algorhythm blog
Sharing knowledge is an important value within Algorhythm. The idea of starting a blog community was a logic consequence to get the information into the world. It’s been a year since we launched our first Read more…

Drill down navigation and default filters in Qlik Sense
oticed things that are straightforward in other visualization tools are not necessarily as straight forward in Qlik Sense. In this blog post I’ll go over some of those that I’ve noticed.

The Benefits of Visual Communication
Introduction While I am a visualization specialist, I haven’t been spending much time recently creating data visualizations. I have, however, been tasked with keeping track of the continuously changing design of a development project that Read more…
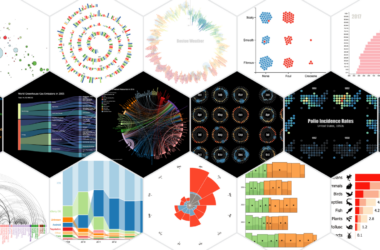
Going beyond Power BI’s standard visuals with Charticulator
I believe the Charticulator visual for Power BI is a game-changer that hasn’t yet received the attention it deserves. Below is a dorky short story meant to gently illustrate how Power BI developers, analysts and Read more…

A New Year’s Message
A fresh year has started, but first I would like to take a moment to reflect on what we’ve realized last year. Being data agnostic is one of the cornerstones of the Algorhythm strategy. This Read more…
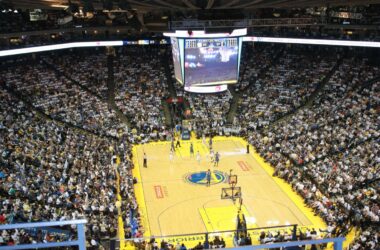
Will data driven decision making be the future of NBA coaching?
Introduction: Basketball, one of America’s most popular sports, has grown into a multimillion association. This makes it one of the breeding grounds in technologic advancements and technologies in the sports world. One of these is Read more…

Remember personalized view
The remember personalized view is an option that allows users to continue where they left when working on the analysis in the TIBCO Spotfire web player, their personalized sessions are remembered by default. For example, Read more…

Validating & Analyzing Data in Tableau
Introduction Tableau is a tool which prides itself on being easy to use and support rapid development of different types of analyses for data. For this reason, I have frequently used it in different projects Read more…