
Introduction
Tableau is a powerful tool for data analysis and utilized by many organizations to extract meaningful and valuable insights from data. Head over to the blogs written by our Analytics & BI unit to learn more on how to get the most out of Tableau for visualization.
For Data Science, Tableau may be less applicable as it is not possible to run Python scripts by default. Fortunately, the free Tableau extension “TabPy” allows you to set up a server for running Python scripts in the background. This approach is model-agnostic, because it allows you to integrate anything you can develop in Python. In this blog, we show how to integrate a Natural Language Processing (NLP) model in Tableau.
In the first section, we introduce a toy problem and train a NLP model to solve it. In the second section, we set up a TabPy server which will host the Python functions to do inference with the trained NLP model. Finally, we create a Tableau worksheet to run the functions deployed to TabPy.
Training the model
Toy problem
Bob is running a popular news sharing Twitter account where he shares articles from The New York Times. He tries to post the latest and most interesting articles which he knows will become popular among his followers. Yes, Bob is fun at parties. There is one problem. Bob wants to post multiple times each day but it’s extremely tiring and time consuming to pick articles from the hundreds of articles that are posted each day.
Bob would much rather have Artificial Intelligence to help him predict and filter out articles that are unlikely to become popular on his feed.
Dataset
We use the New York Times Articles & Comments dataset:
“This dataset contains all comments and articles from January 1, 2020 – December 31, 2020. The articles .csv file contains 16K+ articles with 11 features, and the comments .csv file contains nearly 5M comments with 23 features.”
Approach
Let’s consider two options here:
- Build a regression model and try to predict the amount of comments that an article may receive
- Build a classification model and predict whether articles are likely to become popular
Some approaches to choose from:
- Train a machine learning model on:
- the one-hot encoded categorical features and/or temporal features
- the vectorized contents of the article with BoW/TFIDF/Word2Vec/…
- …
- Train a NLP model such as BERT (Bidirectional Encoder Representations from Transformers) from scratch
- Fine-tune BERT
In the last approach, we can fine-tune a pre-trained BERT model on our own dataset. BERT is a popular and state-of-the-art Deep Learning language model which has shown high performance on a variety of NLP problems. It is based on the powerful Transformer architecture which in combination with fine-tuning can outperform most traditional Sequential models.
As suggested in the second approach, we could train BERT from scratch. However, we would need quite a lot of data (>> 16K articles). Not to mention the amount of GPU power we would need and the time it would take to train it. Fine-tuning a pre-trained model alleviates these issues and allows us to “recycle” a model that was originally trained to solve one problem, and retrain it to solve another problem. If you’re interested, you can read more about Transfer Learning, Transformers and BERT.
BERT can be implemented using Deep Learning frameworks such as Tensorflow, Keras and PyTorch. In this blog, we will explore HappyTransformer, which is a PyTorch wrapper around Hugging Face models and an easier way to perform fine-tuning for NLP problems. The framework allows us to easily fine-tune Hugging Face models and hides most of the low-level complexity to do so. In only three lines, we will have trained and evaluated BERT. Of course, the trade-off is that it is hard to configure the underlying pre-trained model other than providing hyperparameters for training.
Training
We’ll use Google Colab Python notebooks to train the model. Please find and run the notebook with the code here. The notebook contains documentation and explanations in case you want to learn more about what the code does. Make sure to enable GPU hardware acceleration on your notebook for (much) faster training.
You must run the entire notebook to continue to the next section. In a nutshell, the notebook does the following:
- Import the dataset
- Extract the classification label
- Clean and export the data
- Retrain (fine-tune) DistilBERT, a faster and lighter version of BERT, on the data for 5 epochs. With CUDA enabled on Google Colab, the model will roughly take 30 minutes to train. Otherwise, it will take a few hours. You can let it run in the background.
- Evaluate and export the model. This will generate “model.zip”.
Do not forget to download the trained model “model.zip”. You can find it by clicking on the folder icon. This step is necessary for the next section.
TabPy setup
TabPy is an extension for Tableau that we need to make predictions in the background. Since Tableau cannot execute Python scripts, we run a TabPy server which can execute any Python script.
Grab your favorite Linux terminal. We assume that you have Python 3.X installed. Run the commands below which will create a directory, create a Python environment, and install both TabPy and HappyTransformer. The latter can take a while. The last line will run the TabPy server in the background.
Move the model “model.zip” we downloaded previously to the directory created above (tabpy/) and unzip. Create a Python file “scripts.py” and paste the code below. Run the script once. It will deploy the “predict_from_batches” function on TabPy which takes as input a list of articles (strings) and using our trained model, returns a list of (integer) predictions. The TabPy server will notify you if the function was deployed successfully.
Tableau
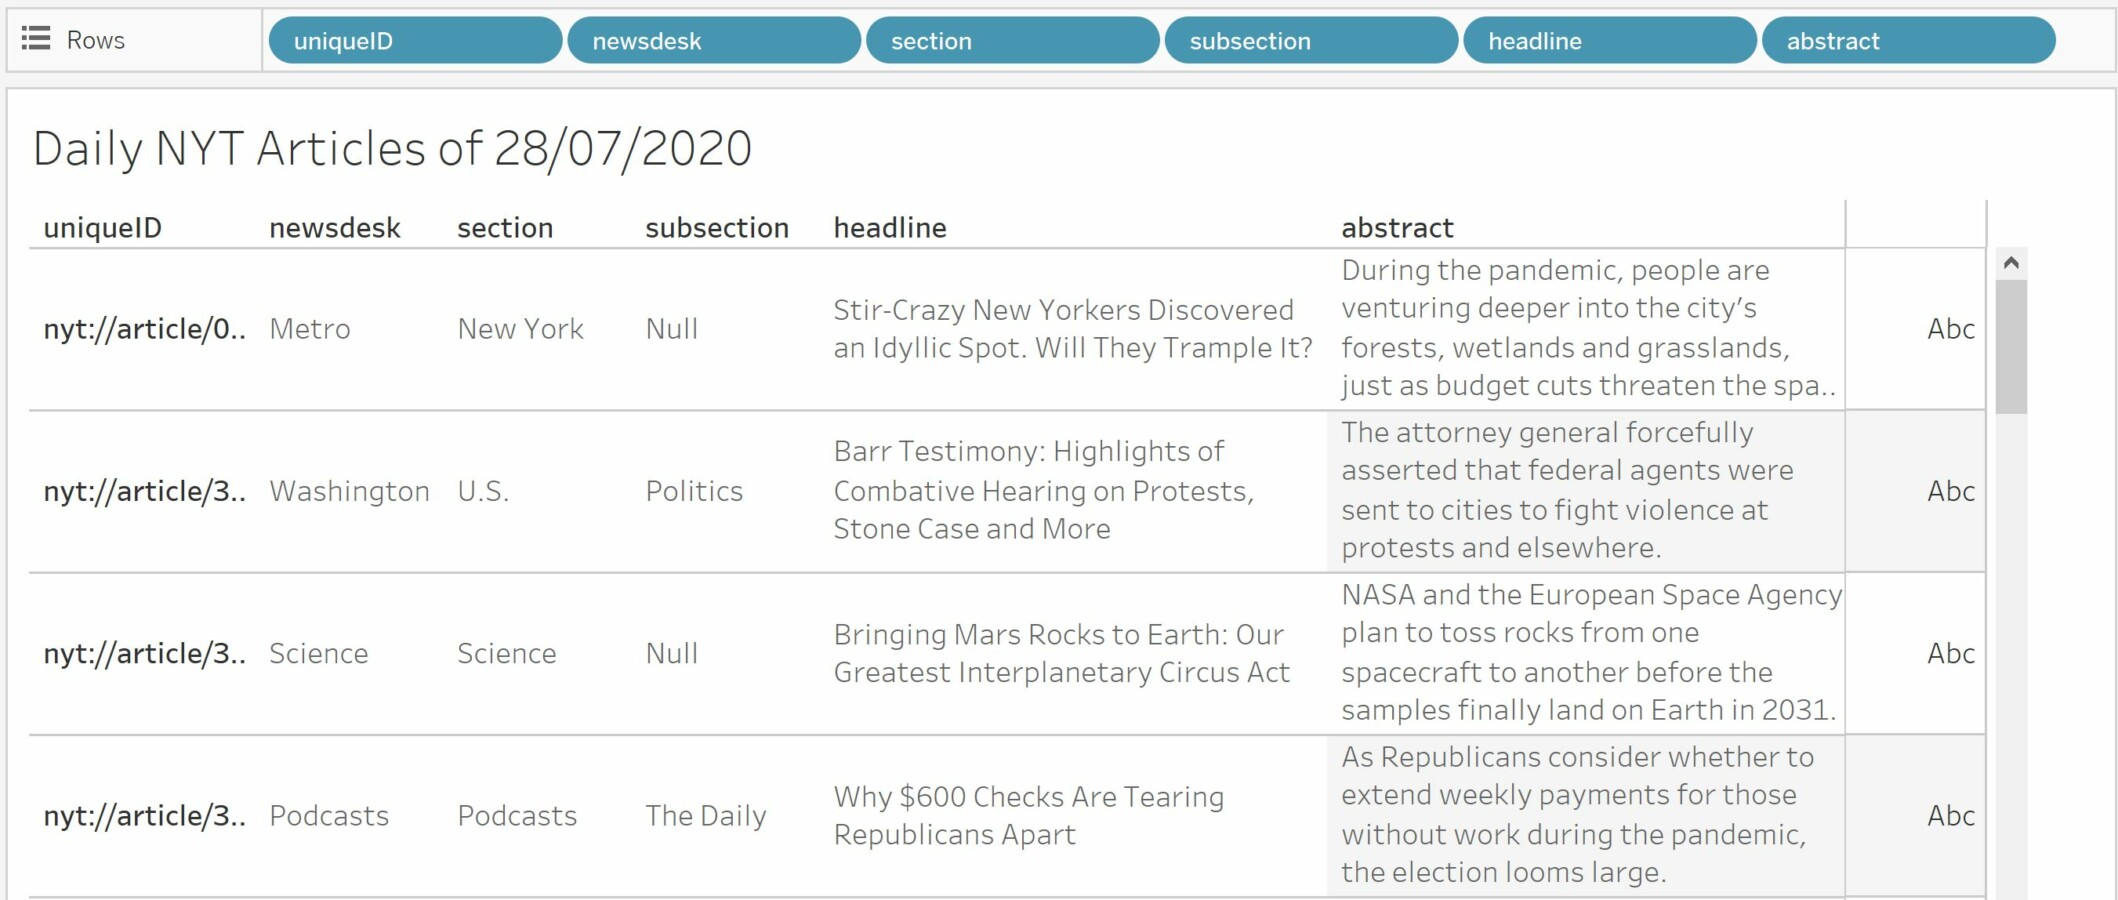
Go ahead and open the CSV file nyt-articles-2020.csv with Tableau. You may have to unzip it first after downloading it from the provided link. I created a very simple worksheet for Bob which displays the articles of a given day. Here, I filtered the articles on an arbitrary date (28/07/2020) as if they were articles from “today”. Because normally, the CSV file read by Tableau should be updated daily to reflect the daily news articles from The New York Times.
In order to connect to TabPy, navigate to: Help > Settings and Performance > Manage Analytics Extensions Connection.
You should see the window below. Fill in “localhost” in hostname and “9004” in the port section. Click on “Test Connection” next. This will test whether your TabPy is indeed running on http://localhost:9004.
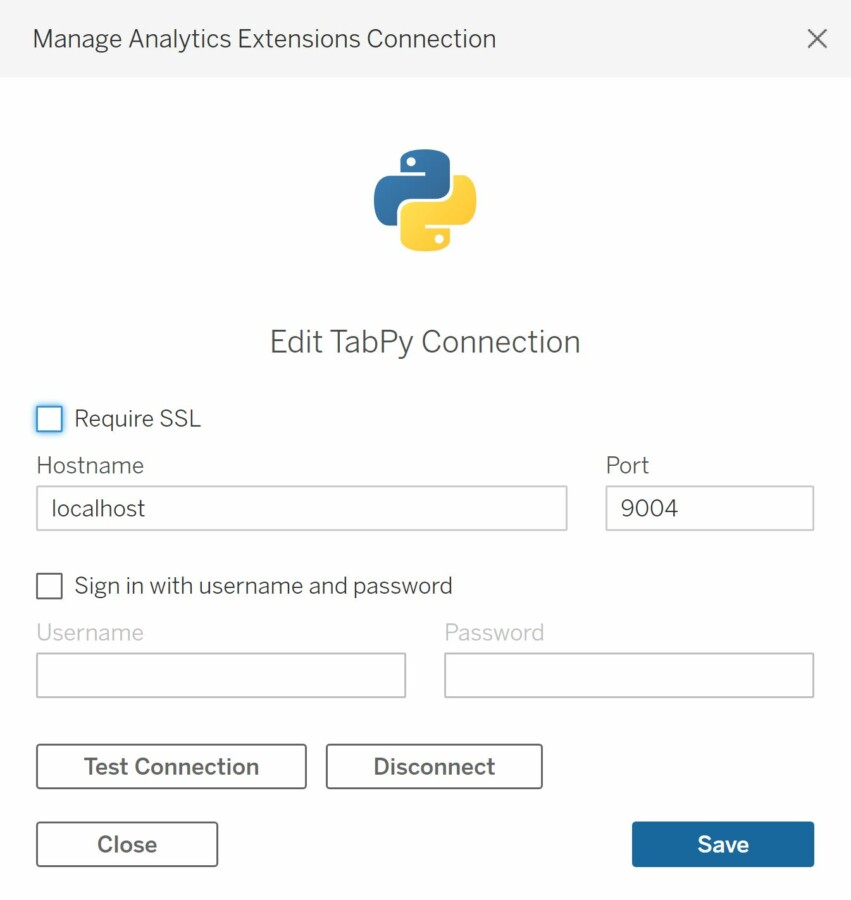
If successful, you will be notified that the connection has been successful. Click on save and close the window.
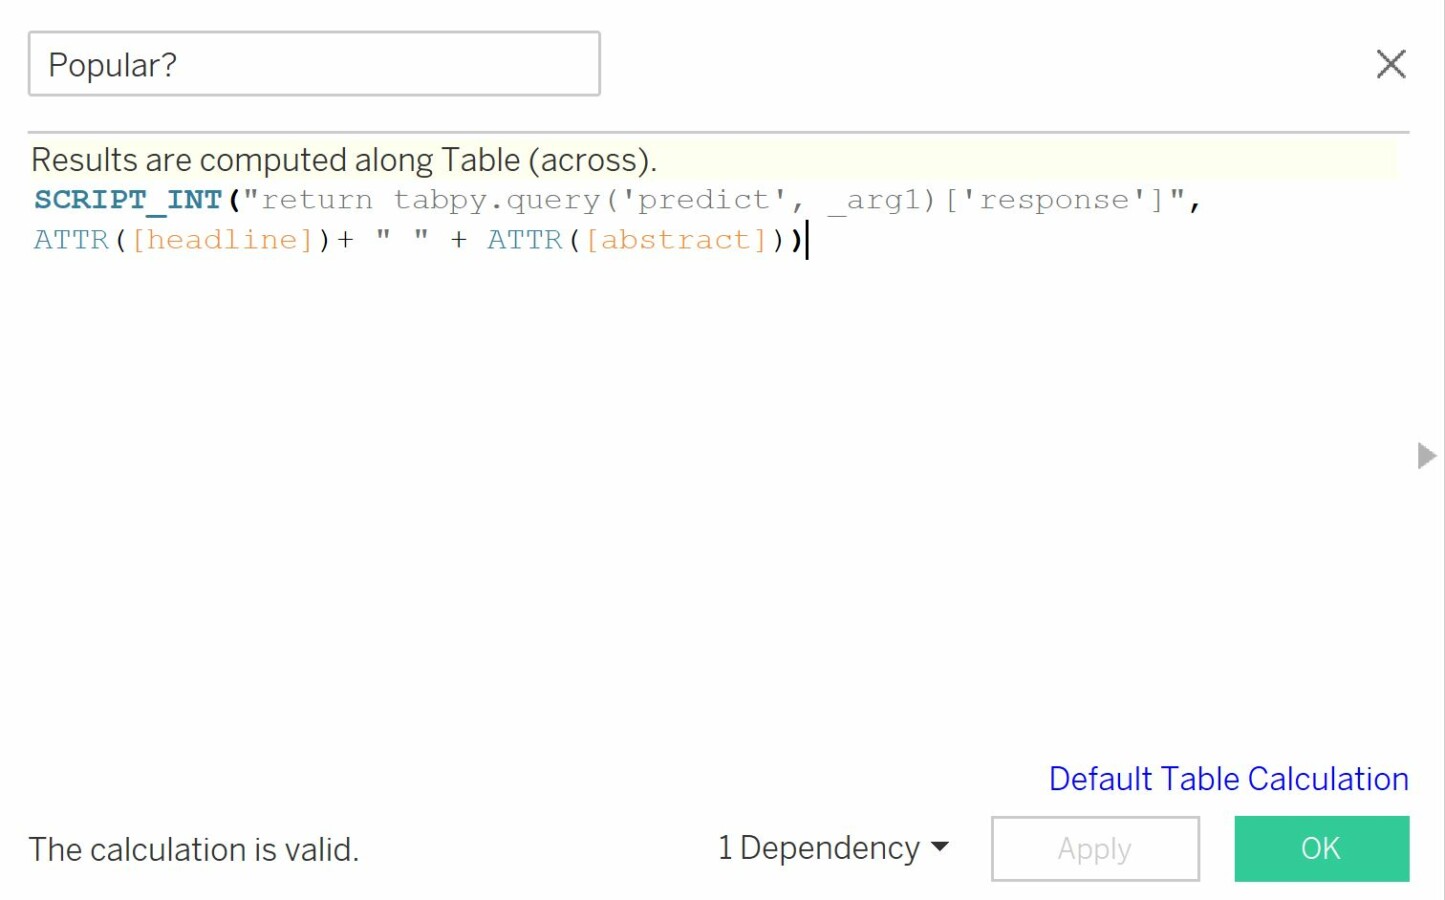
Next, create a Calculated Field “Popular?” which will run the Python script we created earlier containing the function for predicting whether a given article will be popular or not. As arguments, we provide the concatenation of both the headline and abstract. The field returns a list of integers where “1” means that the article was predicted popular and “0” means it was not. Convert the Calculated Field “Popular?” to discrete.
Drag the Calculated Field “Popular?” to the shelf. If necessary, you can create an alias to replace 1/0 with yes/no.
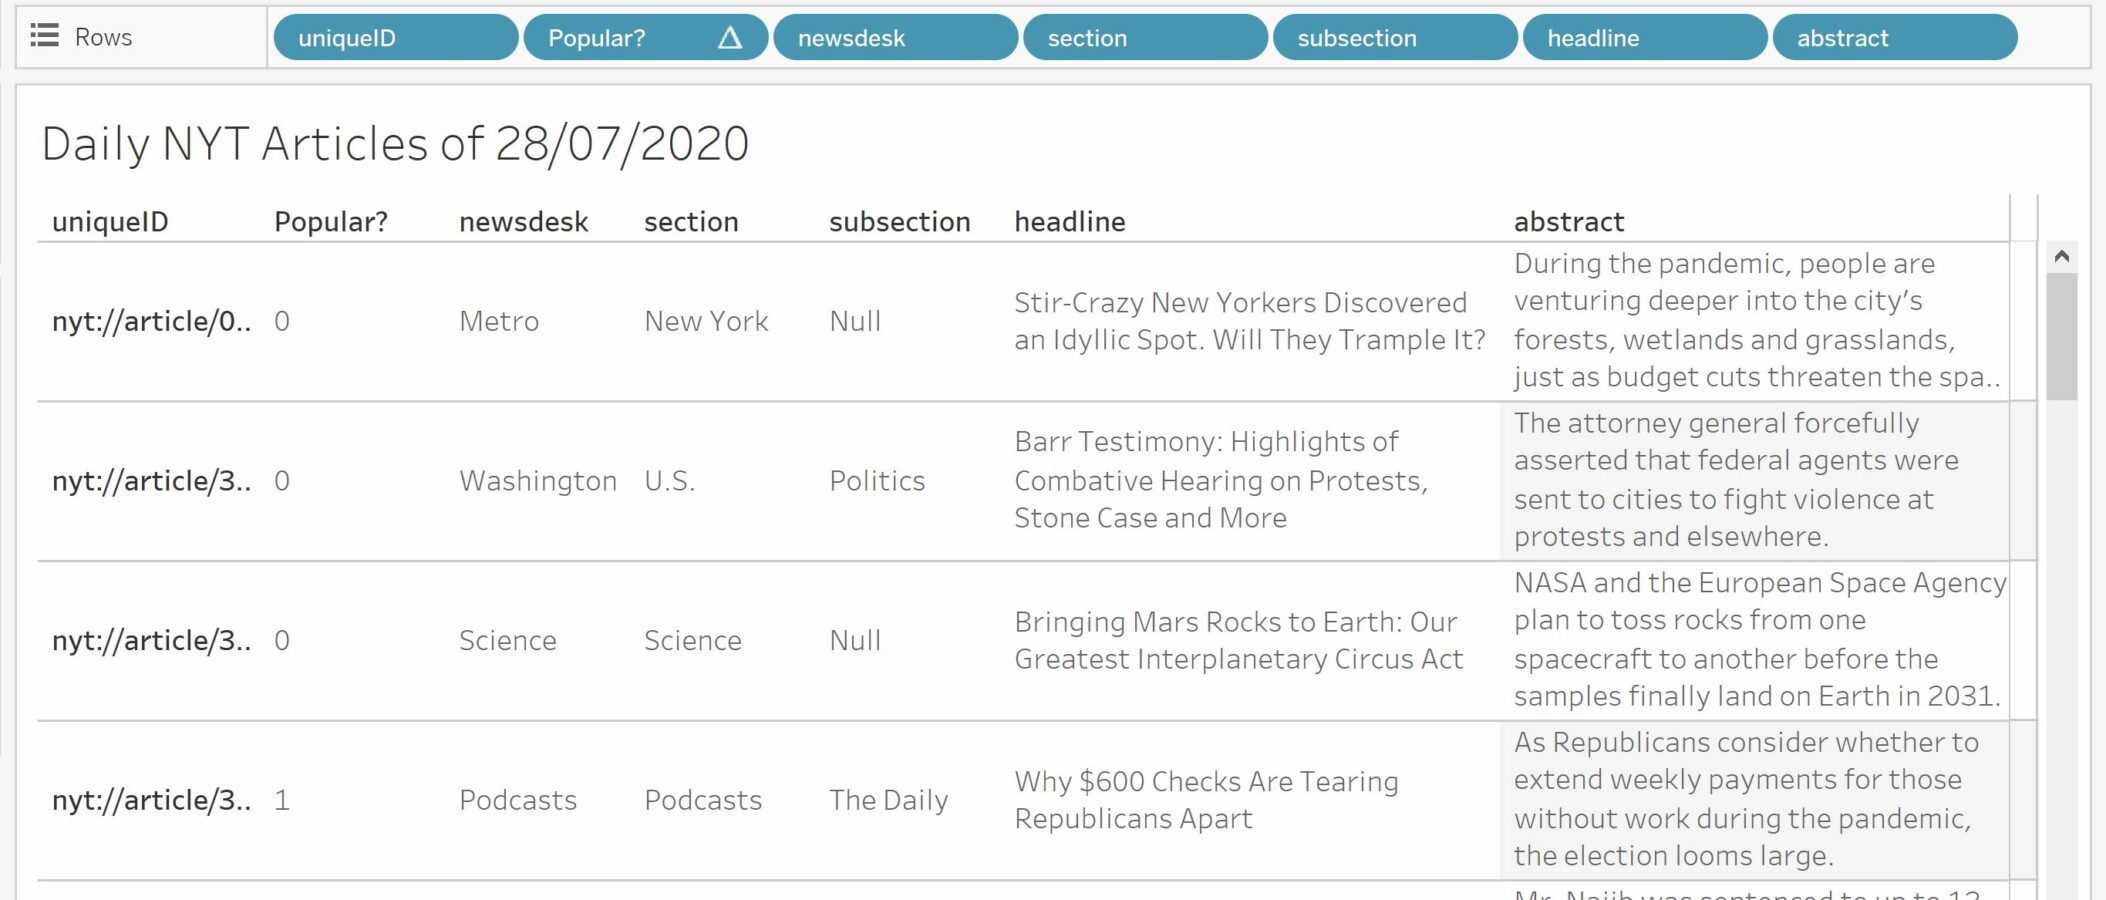
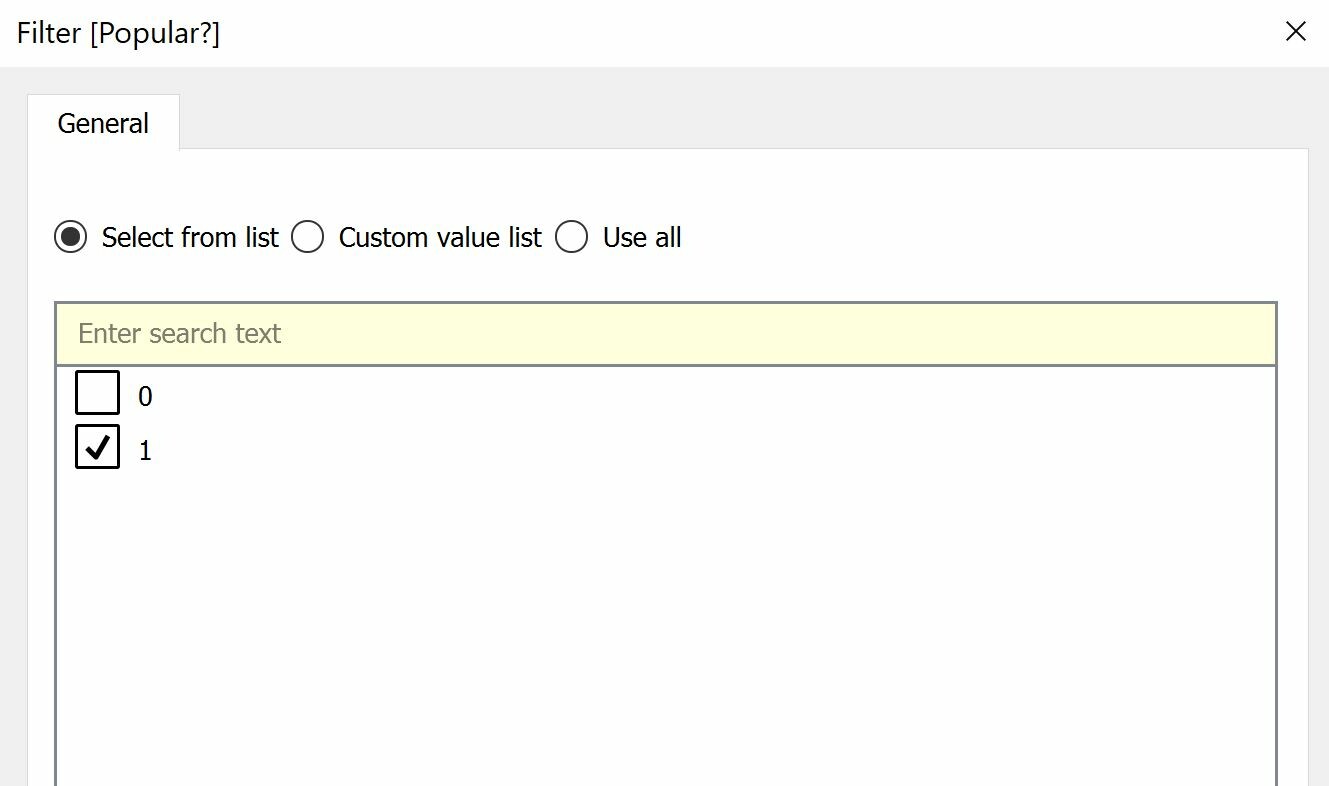
Finally, add a filter for the field “Popular?” and filter out articles that were predicted to be non-popular.
Conclusion
In this blog, we fine-tuned the NLP model BERT using HappyTransformer and used the model to make predictions. Because you can not run Python scripts with Tableau, and thus make predictions, TabPy was used to set up a server for running the scripts. We showed you how you can integrate an NLP model such as BERT. However, TabPy allows you to integrate any Python function that you like. TabPy neatly separates your visualization tool from your data science applications and makes Tableau even more powerful and versatile.