

All of the players in the BI market are currently also focusing on adding AI related components to their suite. In this quarter’s blog post I’ll shortly go over what Tableau, Power BI and Qlik Read more…
Category: Data Visualization

Qlik Sense – Q1 2024
Version Updates Qlik Sense usually release 1 big update each quarter, so in this blog post we’ll only discuss the one update that was released in the first quarter of 2024. Do note: the Qlik Read more…

Tableau – Q1 2024
Version Update Usually Tableau releases one update per quarter. In this blog post we’ll go through some of the features added in the first release of 2024 (2024.1). The following list show all features added Read more…

Power BI – Q1 2024
Version Updates Almost every month is being updated. These updates introduce additional features to enhance your ability to integrate or analyze, while also addressing any issues such as bugs or security vulnerabilities. In this blog Read more…
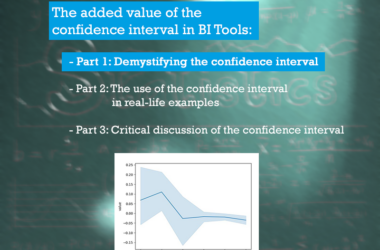
The added value of confidence intervals in BI tools
Part 2 – The use of the confidence interval in real-life examples Introduction Welcome to the confidence interval blog part 2. In this blog I will focus on the practical use of the confidence interval Read more…
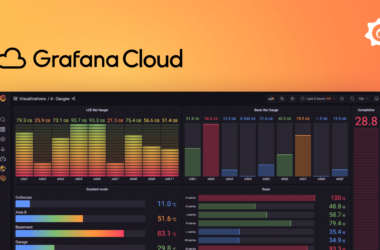
Grafana, a way to visualize live data
In this blog post we are going to explore the online tool Grafana. Grafana is the ideal tool to visualize real time or live data that is accessible in an online dashboard.As example I will Read more…
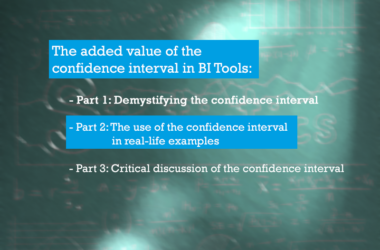
The added value of confidence intervals in BI tools
Part 1 – Demystifying the confidence interval Introduction I’ve always been intrigued by a statistic metric in the human sciences called the confidence interval. In summary, the confidence interval is defined as a statistical measure Read more…
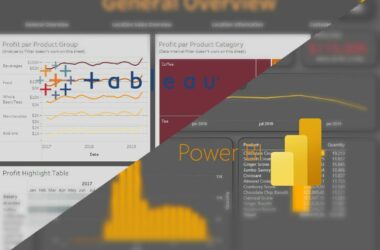
A Comparison between Tableau & Power BI
Over the past years, we have had several trainees at Algorhythm. This is a good opportunity for the students to get to know us better. Ferre Van Hoof shares his experience and findings about the Read more…
How To: Contextualizing Visualizations
Introduction In my previous article, Contextualizing Visualizations , I laid out my perspective on why you should consider the context in which you present your visualizations. There is no one best-way to do this, but Read more…

Strategical day data visualization and analytics
Once a year we bring our data visualization and analytics team together to talk about their strategy within Algorhythm. During this day we talk about our vision, mission and values. Sometimes we need to update Read more…