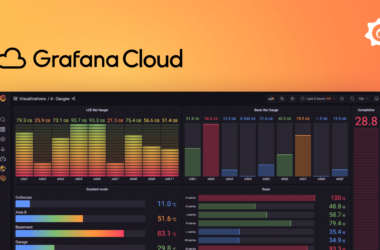
In this blog post we are going to explore the online tool Grafana. Grafana is the ideal tool to visualize real time or live data that is accessible in an online dashboard.As example I will Read more…
Category: Tips & Tricks
Transform your job into your hobby!
My job, my hobby … Being able to perform tasks in which you are successful, which go very smooth, which energize you and give tons of satisfaction?On top of that, people call it your job Read more…
Contextualizing Visualizations
Introduction Imagine you are walking through a factory and in front of you are 3 machines producing bolts for construction. Above each machine where the bolts come out is a screen showing the bolt defects-per-million-opportunities Read more…
Time to split: are datetimes bogging down your model?
We’re not breaking up. I just wanted to talk to you about… Why keeping datetime columns whole can hurt Power BI performance Time is a component of most data models. Often at the granularity of Read more…
Drill down navigation and default filters in Qlik Sense
oticed things that are straightforward in other visualization tools are not necessarily as straight forward in Qlik Sense. In this blog post I’ll go over some of those that I’ve noticed.
Going beyond Power BI’s standard visuals with Charticulator
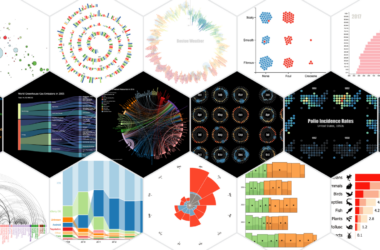
I believe the Charticulator visual for Power BI is a game-changer that hasn’t yet received the attention it deserves. Below is a dorky short story meant to gently illustrate how Power BI developers, analysts and Read more…
Remember personalized view
The remember personalized view is an option that allows users to continue where they left when working on the analysis in the TIBCO Spotfire web player, their personalized sessions are remembered by default. For example, Read more…
Validating & Analyzing Data in Tableau
Introduction Tableau is a tool which prides itself on being easy to use and support rapid development of different types of analyses for data. For this reason, I have frequently used it in different projects Read more…
COVID-19 related dashboards for companies
Introduction The COVID-19 pandemic shows how important data and data visualizations are: they are showing data and visualizations in the news, newspapers, on social media,… everywhere you see dashboards are popping up about the number Read more…
Spotfire input field with calendar filter
Let’s say you wanted to use a single filter to limit the data for multiple visuals, however each of these visuals aren’t using the same date to filter. (e.g. creation date, start date,…). An easy Read more…


