

After using Qlik for the last couple of months, I’ve noticed things that are straightforward in other visualization tools are not necessarily as straight forward in Qlik Sense. In this blog post I’ll go over some of those that I’ve noticed.
Default filter when no selection is made.
Let’s start with the first item. The users are looking at 1 page of the dashboard and for this specific page they want to see data for the current year if no specific year filter has been selected. But they don’t want to have any other pages affected. In this example we’ll be trying to display the distribution of different calls made per year over the several types of calls. Our data will contain Call ID, (Interaction) Year (which will be derived from a date field) and Call Type.
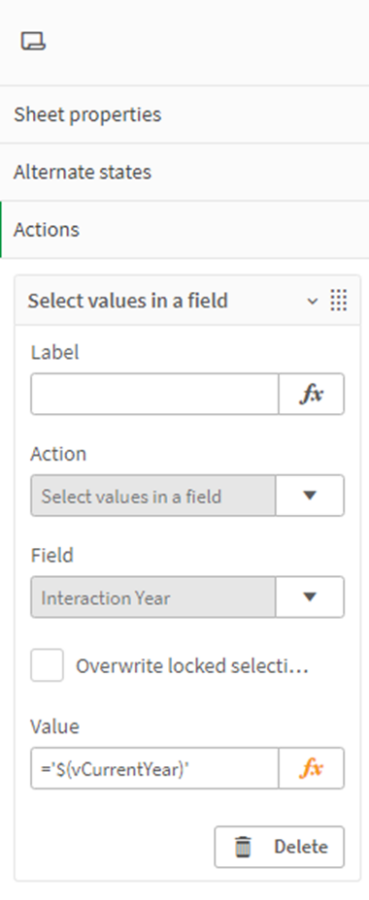
- A possible solution for default filtering a page would have been to use a sheet action to filter on the current year (using a variable vCurrentYear = Year(Today())) but since we don’t want to influence other graphs on other sheets this won’t work.
- Another way to filter a page, or better, to filter graphs on a page is through filtering your measures with a set expression. This is what we will be using.
You can read more about set analysis/expression in the Qlik Sense documentation. But basically, it offers you a way to display the data (filter) in a different way than what is currently selected (through your filters).
To know if a filter is being used on our Year field we’ll be using handy function Qlik Sense has, which is called GetSelectedCount(). This function will count the number of values chosen for a specific field (read filtered). If the Year field has not selections made, GetSelectedCount([Year])=0, we want to display the current year. If selections have been made for for Year, GetSelectedCount([Year])>0, we want to see the graph based on the selections the users have made. This can be done with the following If statement.
if(GetSelectedCount([Year])=0, ‘[Year] = {”$(vCurrentYear)”}’,’$’)
Note that we are using double quotes to represent a single quote since they’re part of an already quoted statement. The dollar sign in the expression is something specific to set analysis/expression. It represents the current selection (filtering) done.
When you’ll try to add this directly into the set expression, you’ll see that it won’t work. Because set expressions can’t work with if statements. A workaround for this is to put the set expression part of the set analysis into a variable as such:
Set vCurrentYearFilter = if(GetSelectedCount([Year])=0, ‘[Year] = {”$(vCurrentYear)”}’, ‘$’)
Our set analysis will then look like this:
count({$<$(vCurrentYearFilter)>}
distinct [Call ID])
/
(count({$<$(vCurrentYearFilter)>}
TOTAL <[Year]> distinct [Call ID])
How would this expression look based on the possible selections made?
- No selections made:
count({$<[Year] = {‘2022’}>}
distinct [Call ID])
/
(count({$<[Year] = {‘2022’}>}
TOTAL <[Year]> distinct [Call ID])
We only take Year 2022 into account.
- A selection is made (either 2021 or all values):
count({$<$>}
distinct [Call ID])
/
(count({$<$>}
TOTAL <[Year]> distinct [Call ID])
As mentioned earlier, $ represents current selection made by the user.
Results:
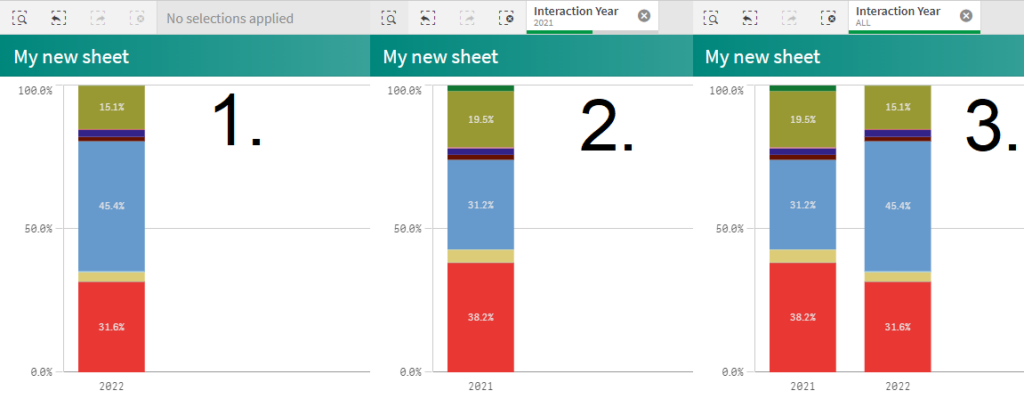
2. Selected 2021
3. Selected all values.
Do note: instead of using the variable you can also use the following notation in your set expression:
[Year] = {“$(=Max([Year]))”}
Drill down navigation
In visualization tools like Oracle BI it is possible to provide the users with a drill down navigation, or journey through different pages, providing more detailed info. In Qlik Sense this is also possible. This is done by using the show condition of a sheet and a button.
- Show condition:
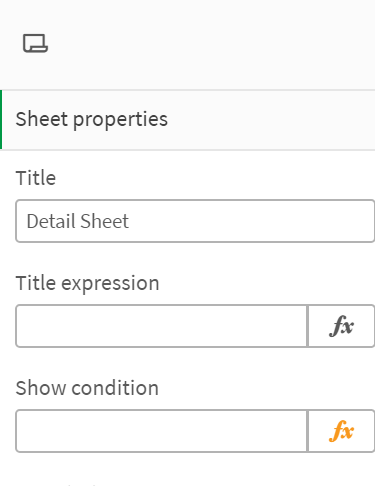
The show condition evaluates the condition to decide if the user is allowed to see the sheet. For example, by inputting 1=2, the sheet will always be invisible except in edit mode.
For our example we’ll use a variable to decide if we’ll show the sheet to the user. In the expression of ‘Show Condition’ we’ll put:
=’$(vDetailPage)’=’Yes’
Make sure to create the variable in your script or within the dashboard editor.
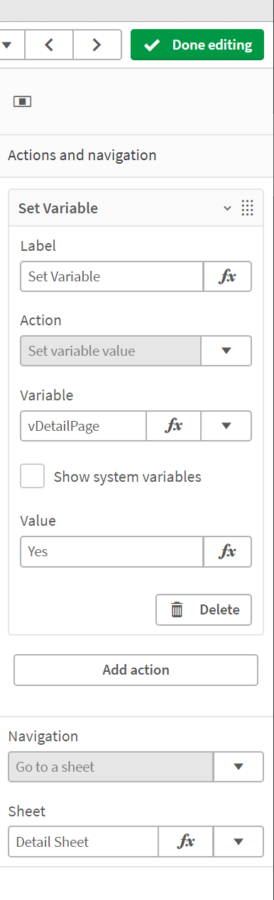
2. Button
Create a button and add the following action and navigation to the settings.
Action: Set Variable -> vDetailPage -> Yes
Navigation: Go to a sheet -> (your detail sheet)
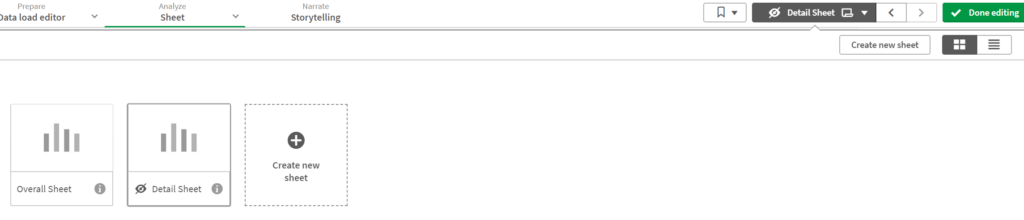
With this setup, you’ll now be able to move the ‘hidden’ detail sheet by a press of a button. If you want to hide the main page when the user is looking at the detail page, you can do exactly the same setup for your main page. As in change the ‘Show Condition’ of the main page and add a button to the detail page to navigate back to the main page.