
We’re not breaking up. I just wanted to talk to you about…
Why keeping datetime columns whole can hurt Power BI performance
Time is a component of most data models. Often at the granularity of days, but sometimes a finer level of detail like minutes or even (milli)seconds is needed. When modelling such rich data it can be tempting to just pull in the timestamp from the source system and keep it as is. Easy life.
While easy, it can take an unnecessary toll on performance. By keeping the timestamps as is, we are also keeping a lot of redundant information because every (milli)second from the source is stored as a datetime. Let me illustrate by showing the first 3 seconds of the year 2022 as datetimes:
| Datetime |
|---|
| 2022-01-01 00:00:01 |
| 2022-01-01 00:00:02 |
| 2022-01-01 00:00:03 |
We can see that the only difference is in the seconds part of time; the dates are equal. If we split the datetime into a date and time like so…
| Date |
|---|
| 2022-01-01 |
| 2022-01-01 |
| 2022-01-01 |
| Time |
|---|
| 00:00:01 |
| 00:00:02 |
| 00:00:03 |
We can simplify the date column by just storing the date once and keeping track of how many times it should be repeated:
| Date |
|---|
| 2022-01-01 but 3 times |
| ⠀ |
| ⠀ |
| Time |
|---|
| 00:00:01 |
| 00:00:02 |
| 00:00:03 |
Now this looks confusing to us humans, but it just so happens that the storage engine under the hood of Power BI loves working like this: it tries to compress columns whenever it can by performing tricks like above. While the specifics are far more complex than I want to get into here (but here are some pointers if you do), the implication is that single datetime columns need more bytes to store information that doesn’t add anything to the data model. Bigger models generally imply poorer performance, but what’s the delta? When does keeping datetimes as such hijack precious RAM?
To test this, let’s try storing datetimes for every second, similar to the first 3 seconds of 2022 but ramping it up to 10,000, 100,000, 1,000,000 and 10,000,000 subsequent seconds. Then split them and measure the total sizes to compare.
*sound of coffee pouring followed by a few keyboard strokes*
The results are in:
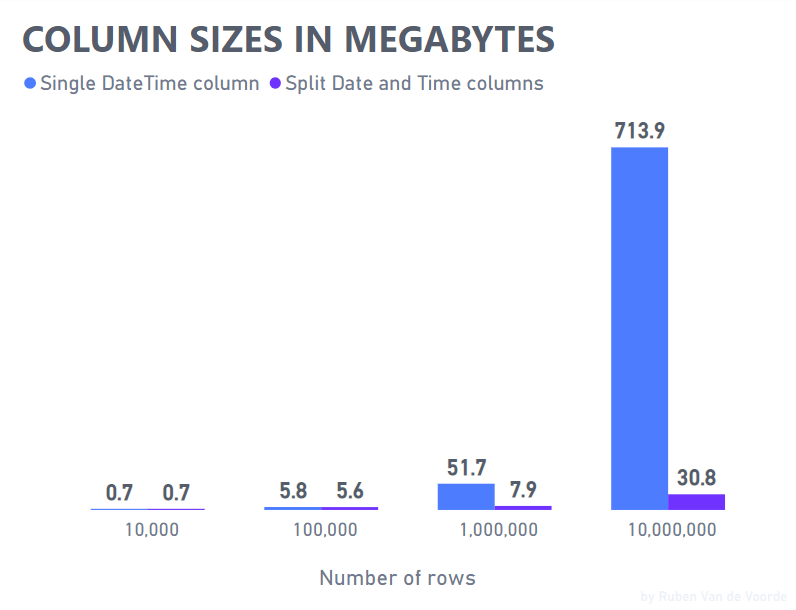
For up to 100,000 subsequent datetime seconds it doesn’t make much of a difference whether the datetime is kept whole or split into separate date and time columns. Splitting 1,000,000 datetime seconds reduces the size to about 15% of its original size and by the 10,000,000th datetime second the difference is even bigger: a separate date and time column only need about 4.3% of the size a whole datetime column needs to store the same information. But why? Meet columnar storage and compression.
Power BI’s VertiPaq storage engine works on columns, not rows. When the storage engine scans a column, it keeps track of that column’s unique values in a dictionary and just stores the location of a value in the column instead of the actual value. As there are only 86,400 seconds in a day, the dictionary needs to keep track of at most 86,400 unique time values and where they occur in the column. This compression pays dividends when the scope spans multiple days and times start recurring. Whole datetimes rarely benefit from the dictionary and reference approach as they tend to be unique values. This uniqueness is what we call the cardinality of a column and is one of the most important concepts to be aware of when modelling data in Power BI.
The test case I created is pretty artificial so your mileage will vary but I encourage you to have a look at the datetimes in your data models and measure to see if splitting them can make a worthwhile difference. Bravo is an excellent starting point but DAX Studio is better suited for more detailed analyses like these.
Drop me a message if you have any questions or suggestions!
Or dive deeper:
- Optimizing High Cardinality Columns in VertiPaq by SQLBI
- Boost Power BI performance by improving cardinality levels by Nikola Ilic
- Inside the VertiPaq Engine by Marco Russo
Happy splitting!