


Introduction:
Basketball, one of America’s most popular sports, has grown into a multimillion association. This makes it one of the breeding grounds in technologic advancements and technologies in the sports world. One of these is the collection of massive amounts of data from every game played. This information can vary from shot positions to which player has the best shooting statistics on basically every area of the field.
Because of this amount of detailed information, the NBA seemed the perfect use case to create some insights in Tableau about different teams between the 2019 and 2020 seasons and get some conclusions about a certain team or game. All the used data is available on the website from the NBA. I hope this article will give an example of how the data generated can be an extremely valuable asset for the teams and for improving the sport.
Use case:
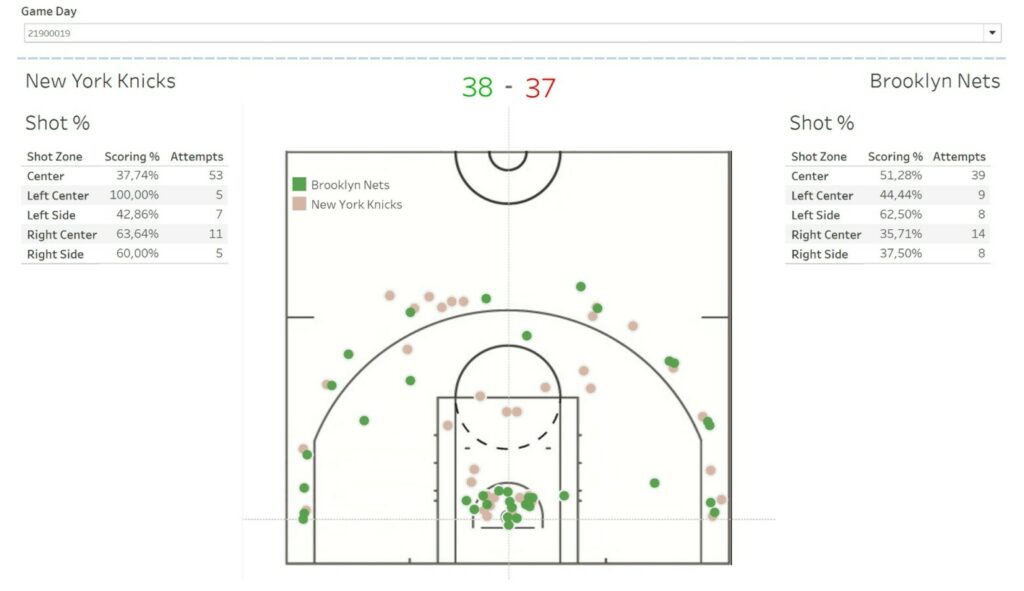
Above we can see the result. I chose to show the data from one particular game to avoid cluttering and have a clear insight about the strengths and weaknesses of each team. This will be just my interpretation and I am not an expert at all in basketball. I do hope to show how coaches can possibly use the data given to analyse their teams game and improve in the future.
In the visual we can see the numbers of the New York Knicks and the Brooklyn Nets.
I chose this game because although it was a very close match the teams have very different stats and had some interesting strengths and weaknesses.
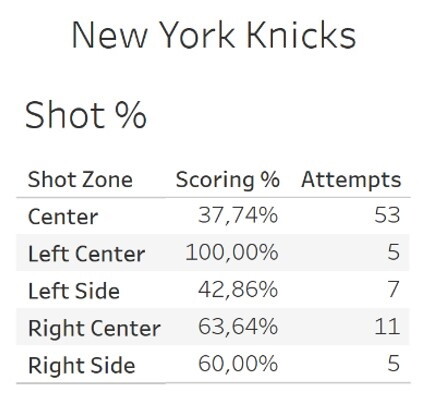
When we analyse the game further we, can see that the New York Knicks score mainly from the sides of the field. Although there were still a lot of attempts in the center field, the scoring percentage was rather low. This can tell us one of two things, maybe the Brooklyn Nets defence was just really strong that day in the center field or the center field players of the New York Knicks were having an off day. They adapted really well by having very strong numbers around the sides of the field and have well made up their low center percentage to take the win.
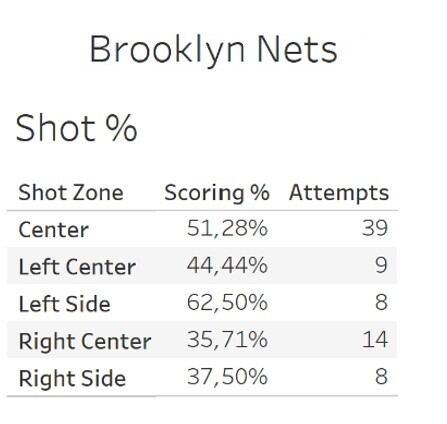
The Brooklyn Nets however have a more traditional dispersion of their shot percentages. Being that the scoring percentage is stronger in the center field and somewhat less strong around the sides.
Something that is also noticeable is that the Brooklyn Nets have less shot attempts so maybe they had less ball possession over the New York Knicks. But it being such a close match shows us that sometimes quality is just as important as quantity.
In future matches the Brooklyn Nets can maybe focus their defences more on the sides of the field to exploit the low scoring percentage of the New York Knicks in the center. This will hopefully slow the Knicks down and force the game more to the center field where the Brooklyn Nets are significant better. This will maybe be enough to turn the loss around to a win.
As you can see just this simple visualisation can bring up many questions and theories to outsmart your opponent and come out on top.
Conclusion:
To answer my question “will data driven decision making be the future of NBA coaching?” I think the answer is yes. In my opinion knowing what team you’re facing with their strengths and weaknesses is just as important as having the best players on your team. I am not at all an expert when it comes to basketball. However from this one visual, I can get some conclusions as why the Brooklyn Nets may have lost the game.
Moreover, I think this will make teams play more creative, by surprising the opponents with their weaknesses in mind.
Overall, I hope this was a good example of how data can be implemented in just about anything for further improvements down the line. Expertise and good intuition will never be fully replaced but it can be an extra tool to use to get that extra edge over your opponents.