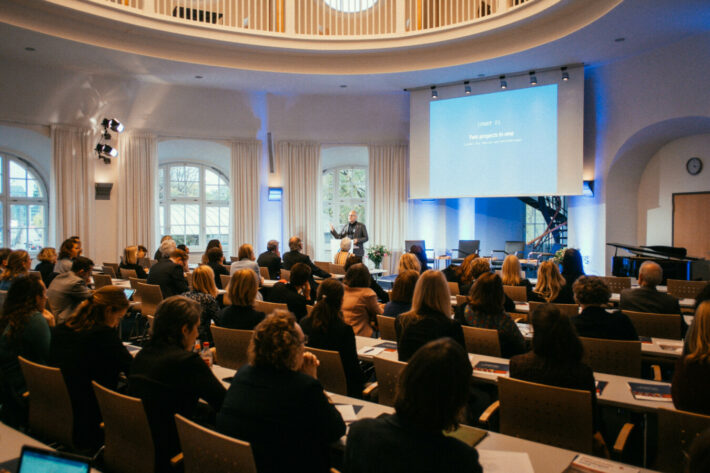
Working in the public sector for the past years, I’ve grown interest in the sector. I was eager to know what other governments and EU institutions were doing with open data and data visualization. Are there solutions where I can learn from and what are the latest trends? That’s why I joined the EU Open data Days.
What are the EU Open Data Days?
The first EU Open Data Days took place online on 23-25 November 2021. In the past years there was a similar event EU DataViz. With EU Open Data days, the conference has grown from a one-day event to a 3-day event. Each day had a different topic, the first day was about open data, the second day was about data visualization (DataViz) and the last day there were the finals of the EU Datathon, an EU open data competition.
The conference is especially for people with an emphasis on the EU’s public sector, but everyone who has interest in Open Data and Data visualization can join the conference. There were more than 2000 registrations in almost 50 countries.
Day 1: Open Data
The day started with a couple of key speakers, followed by some thematic sessions. Personally, I followed the thematic session about “Data for people”. So, hereby what I’ve learned that day or what I will remember of the speakers.
There was an inspiring talk about how we need to move from data intelligence to decision intelligence. If you look on the internet there is a lot of open data, but how do we use this data to make decisions? A possible solution is to place the data by the decision. For example: place the impact of flight on the environment in the flight booking system. So users can choose a flight with less impact on the environment, but that flight is maybe more expensive. You can say there is a gap between knowing something and doing something with it. The question is what can we do more?
Another interesting idea is: “from data intelligence to decision intelligence, it’s a social phenomenon”. You need to share as much data as you can so that the decisions that are made are group-driven and not from 1 dictator. You need a group of people moving in the right direction. How can we trigger this social response?
I think we need to take these ideas with us if we are using data. Are there ways we can do better?
Day 2: Data visualization
The second day followed the same program with the key speakers and thematic sessions. I followed the thematic session about “Serving citizens with dataviz”.
One of the talks was about: dataviz in social media, the European Commission uses dataviz to tell stories about different topics. For them, it’s an easy way to tell the key messages to the users and grab their attention when they’re scrolling through their social media feed. While posting dataviz on social media it’s important to be selective, to be unique. You also need to take into account the timing of the post. I think it’s interesting to see how they are using social media to reach as many people as they can.
Another talk I found really interesting was about “applying diverse, equitable and inclusive awareness in data visualization”. Considering missing groups: gender is not binary, but in a lot of questionnaires there are only 2 options, or crazy options like ‘Not Available’, ‘Human’, ‘Unknown’. Also with races, we have a similar problem: ‘African American’, ‘White’, ‘Asian’, … and then ‘Other race’. Do you want to be considered as “other”? Maybe you can use an alternative as ‘Another, or ‘Identity not listed’, … It’s something I didn’t take into account, but I will think more about it. Also with colors, icons and language, we need to be careful.
I’ve learned a new word/concept: “Scrollytelling”. Scrollytelling is using data visualization storytelling on a phone or tablet. You make a visualization where you guide the user through the story by letting him scroll through the visualization.
Day 3: EU Datathon
Unfortunately, I didn’t follow this day, so I can’t tell you who won the Datathon. But you can find more information on the website: https://op.europa.eu/en/web/eudatathon
Conclusion
In the 2 days, I followed the conference I’ve learned new concepts and insights. I found it educational to hear about other people’s ideas and solutions. If you want to see/hear the conference for yourself. All the slides and recordings are publicly available on their website: https://op.europa.eu/en/web/eudataviz/programme.
