
Introduction
Self-service analytics (or self-service BI) is a concept that’s gained a lot of traction in the last decade. I’ve been told it will put me out of a job. I’ve also been told that it was a fad and that businesses aren’t seeing any actual need for it. I disagree with both takes. Self-service analytics can be an incredibly valuable component of a business intelligence environment for organizations who manage to successfully deploy it.
What is it?
We’re already in the second paragraph of this article and you may still have no idea what self-service analytics is, so let’s fix that. Gartner defines self-service analytics as form of business intelligence (BI) in which line-of-business professionals are enabled and encouraged to perform queries and generate reports on their own, with nominal IT support. That is a bit of an underwhelming definition for what self-service analytics allows companies to do.
What it really represents is a shift away from the traditional IT-led approach to handling BI within organizations. Responsibilities are distributed across more roles, bottlenecks are eliminated, and, ultimately, working with data becomes quicker and easier, enabling business users to engage in a more data-driven way of working. The ultimate goals of self-service analytics are:
- Empowering people to ask and answer their own questions with data
- Enabling people to easily share their insights with their team and organization
- Ensuring that the data driving decision making is accurate
The Standard Approach
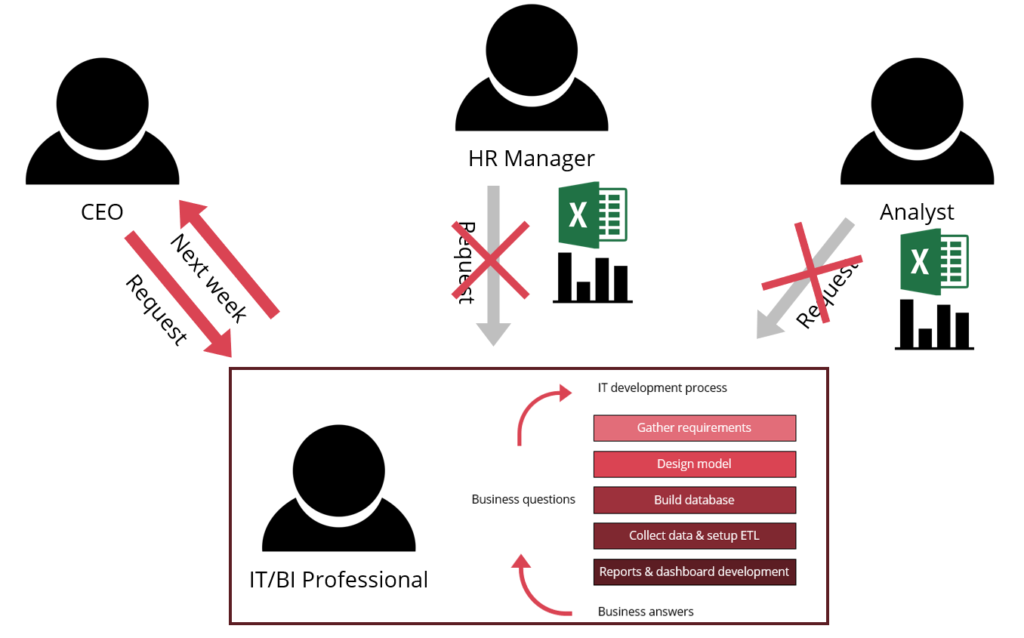
In a traditional IT-led, top-down approach to BI, you will typically have an experienced BI developer, or team of BI developers, who work with end users to satisfy their data needs. These BI developers are masters of the full set of skills needed to realize BI projects and everything goes through them and the deliverables that result from this process are high quality and address the needs of their users.
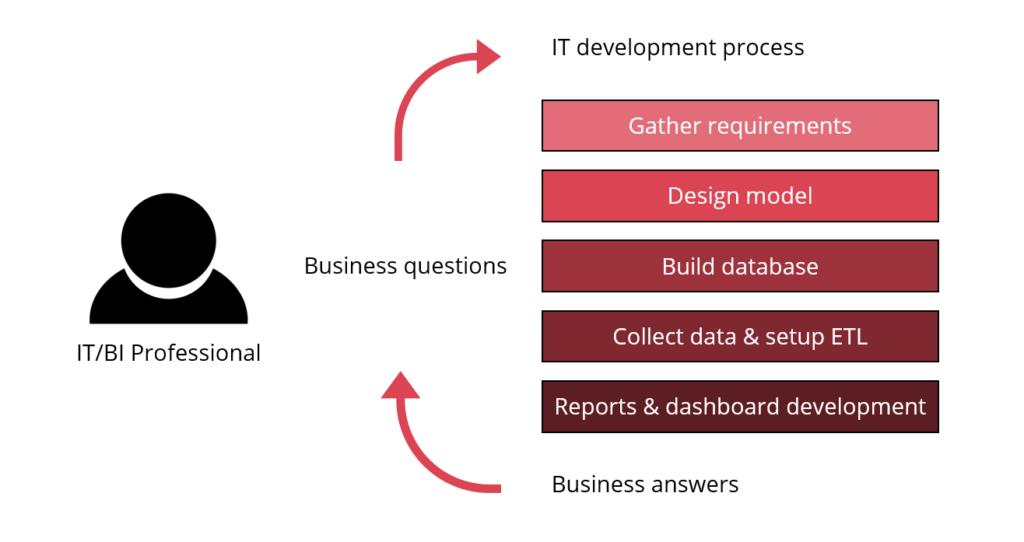
Whenever business users need to access data or get reports created, they typically open a request with IT and start the lengthy process of explaining their problems, clarifying requirements, and going through iterations of the report until they are satisfied with the end result. This way of working is proven to provide great value for companies, but is prone to bottlenecking due to too many requests. A simple question can sometimes only be answered long after it has become irrelevant.
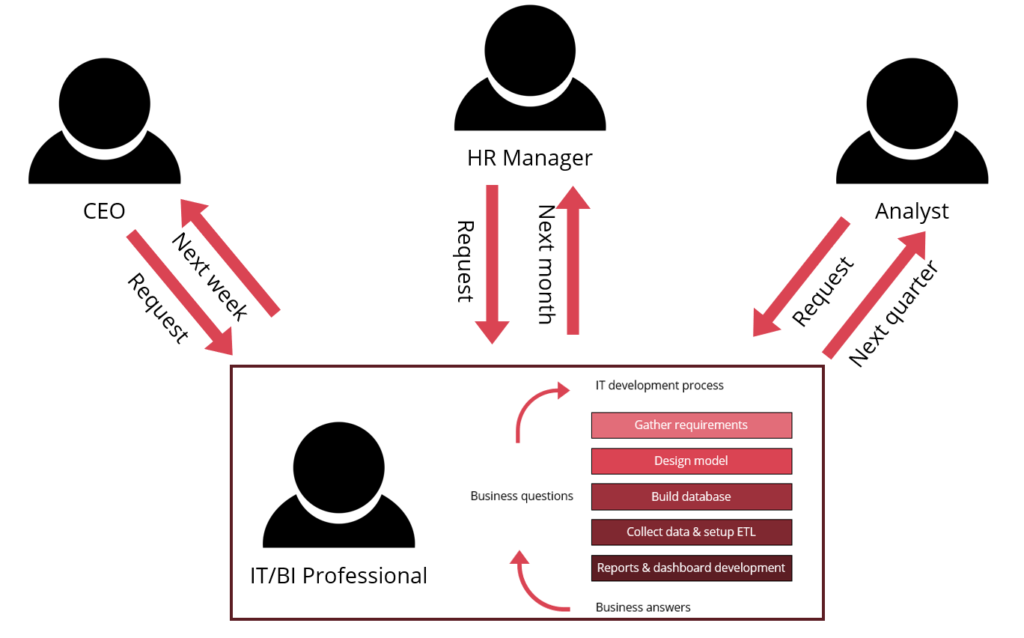
Not getting questions answered in time isn’t the only problem this can create; it can encourage the development of personal data silos by employees just trying to get their job done. You can start seeing copy of copy of financials_2020.xlsx being passed around with reports created off of it and, before you know it, meetings start focusing on “how did you get that number? I have something else” and “when was this data updated?” instead of focusing on making data driven decisions.
The Self Service Approach
While the traditional approach is undoubtedly valuable to companies, it can clearly lead to compounding problems, especially when resources are limited. Thankfully, advances in BI platforms and tools are making it easier to step away from solely relying on this model and introduce self-service analytics as part of their strategy.
How they are doing this is by making it easier for non-technical users to access and work with data; for technical users to develop, curate, and maintain datasets; for all users to consume, share, and collaborate on reports, datasets, and analyses; all while giving organizations an environment to deploy their data strategies and continually evaluate what’s going right or wrong.
The diagram below comes from Tableau, it is what they call the “Modern Analytics Workflow”. While I don’t think self-service analytics is limited to Tableau and their offering (for example, Power BI provides similar capabilities), I think this model provides a compelling representation of the roles and components within modern BI platforms that build the foundation of self-service analytics, so why reinvent the wheel? (Literally. It’s a wheel. I’m hilarious.)
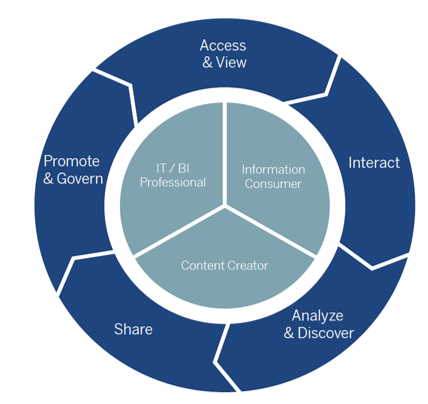
Kevin Taylor gave a good examples of the different types of use cases which fall under these components and roles in his presentation (8:10-9:59). While we can’t lay out every component of every BI platform in this article, an overview of what types of features you can find within them and how they address problems that traditional BI faces will certainly paint a picture of how self-service analytics can run alongside traditional BI processes to improve the way companies work with data.
| Feature | Roles | Problems solved or benefits |
| Web authoring | Content Creators, Information Consumers | • Allow users to view and work with data all in one environment • Allows quick access to data to answer questions without waiting on others • No extra help from IT needed for installs |
| Centrally hosted datasets | IT/BI Professionals, Content Creators | • No more working in Excel silos or extracts • IT/BI can develop, publish, and document datasets • Data governance centrally managed • Content creators can analyze data without having to put it together themselves |
| Report copying and customization | Content Creators, Information Consumers | • Create custom versions of reports without altering the original • Users can make little changes without relying on IT/BI |
| Certified reports or datasets | IT/BI Professionals, Content Creators | • Promote datasets or reports within the organization |
| Customizable content organization | IT/BI Professionals, Management | • No more mailing around Excels and PDFs of reports • Clear definable structure for content • End users know where to find their data |
| Varying levels of access and permissions | IT/BI Professionals, Management | • No accidental breaking of reports • No one seeing what they shouldn’t • Manage who can view, who can interact, who can edit, who can save changes • Manage content with organizational groups or roles (i.e. with Active Directory) |
| Data refreshing | Information Consumers, Content Creators, IT/BI Professionals | • No more out of date analyses • Manage load on systems with customized refresh schedules |
| Usage tracking | IT/BI Professionals, Management | • See what reports are popular, which are not • Find trending topics within the organization |
Conclusion
Organizations today cannot dismiss that the need for traditional BI processes still exists, whether for standard reporting, complex and comprehensive analyses, or intensive data-focused projects which require the entire stack of BI skills. However, they also cannot dismiss the growing capabilities of BI tools in the market and their ability to remedy some of the problems faced in BI processes and enable more widespread use of data in organizations.
Self-service analytics is not a replacement for BI professionals, it is an extension of the environment that they build and manage and one which can only be successful when a company has taken steps to ensure their BI organization has a strong foundation. Luckily, that’s something Algorhythm can help with.