
I believe the Charticulator visual for Power BI is a game-changer that hasn’t yet received the attention it deserves. Below is a dorky short story meant to gently illustrate how Power BI developers, analysts and especially business users can greatly expand the visualization options available to them by incorporating the Charticulator visual in their workflow. Any similarity to actual persons or actual events is purely coincidental.
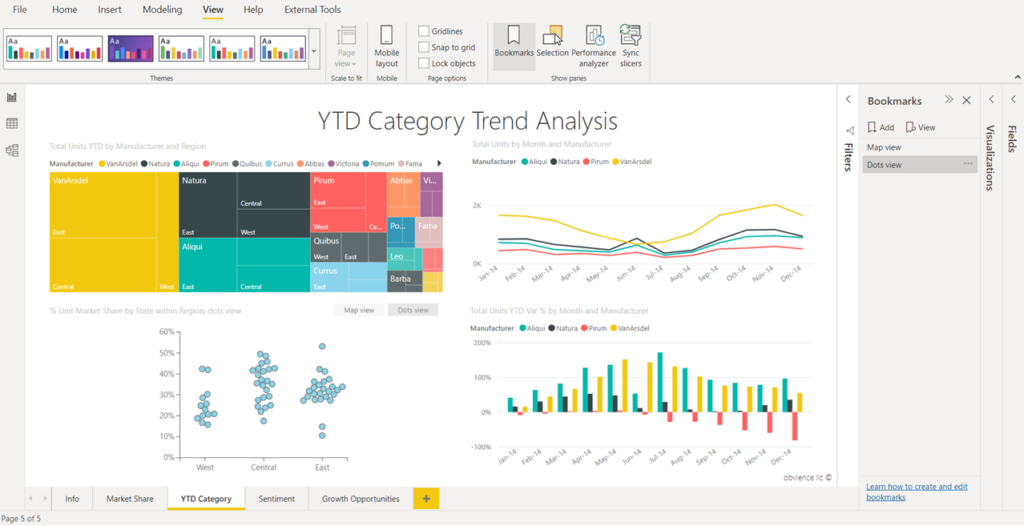
Harry is a Power BI Developer for the Contoso Corporation. Last week he published a Sales and Marketing report and feedback from all stakeholders has been glowing. They finally have access to all the insights they could wish for! Below is the page of his report focussing on Category Trend Analysis:
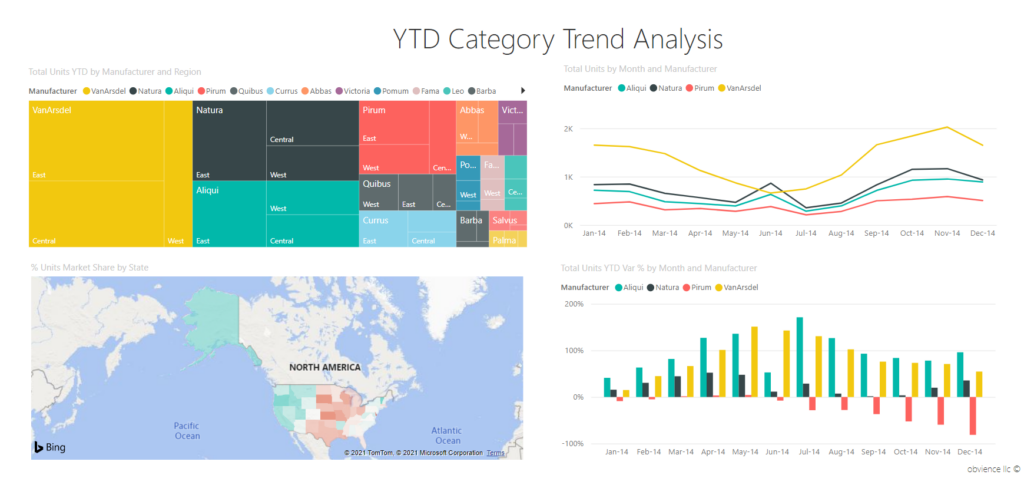
This morning Harry logged in to a mail from one the stakeholders asking for a dot plot in addition to the map chart to show the market share by state, saying that a dot plot would be more effective to accurately compare the states and would visually show the distribution within each region. “Can’t argue with that”, Harry thinks, “maybe I can add it as an optional view”.
Then reality hits him. Harry knows Power BI’s standard Scatter Chart limitations won’t allow him to plot a dot for each state and have region as categorical variable on the X axis. He knows rendering it as a script R or Python visual will not allow the dot plot visual to cross-filter other visuals. He knows there might be a 3rd party visual in AppSource but paywalls and missing customization options left a sour taste since last time he tried them.
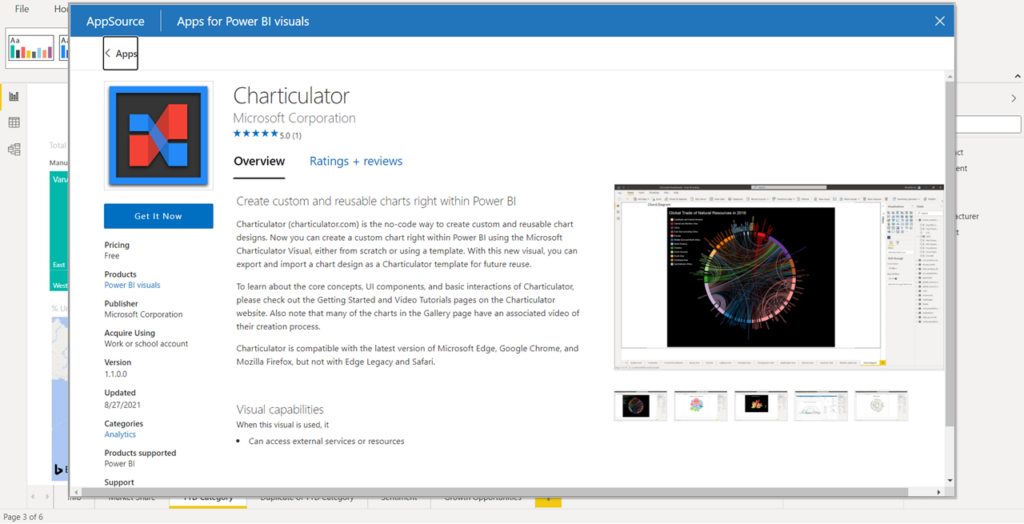
Sweat droplets start to form on Harry’s forehead. He is ready to bite the bullet and make excuses for why he can satisfy requirements X and Y but Z is not possible at this time. As he is typing his reply, Harry vaguely remembers hearing about Charticulator. He doesn’t really have time to go on a wild goose chase but decides to find out what it’s all about anyway and closes his draft. Inspection (i.e. googling “Charticulator”) reveals that Charticulator is a free and open-source browser tool to create bespoke charts without programming and has its own Power BI visual since april 2021. “Screw the meeting at 10“, Harry thinks, “that one should probably be an email anyway” and dives in headfirst.
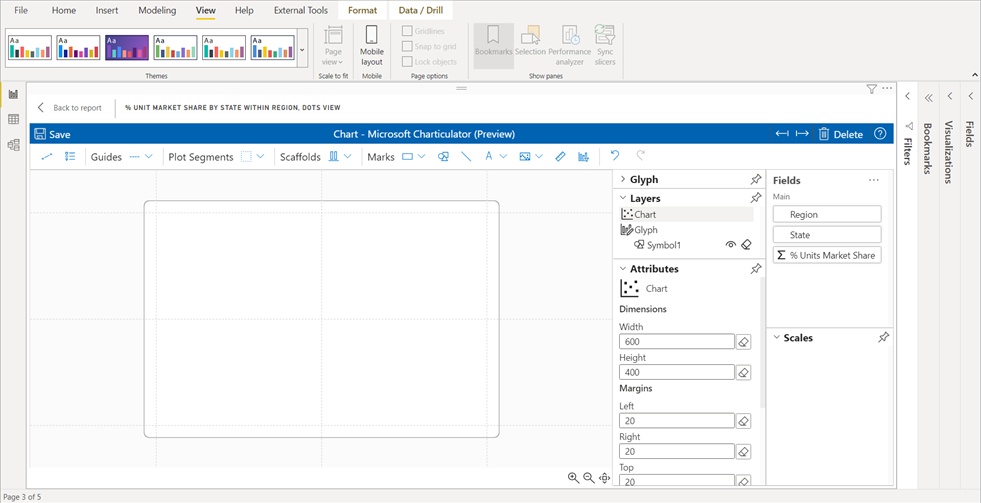
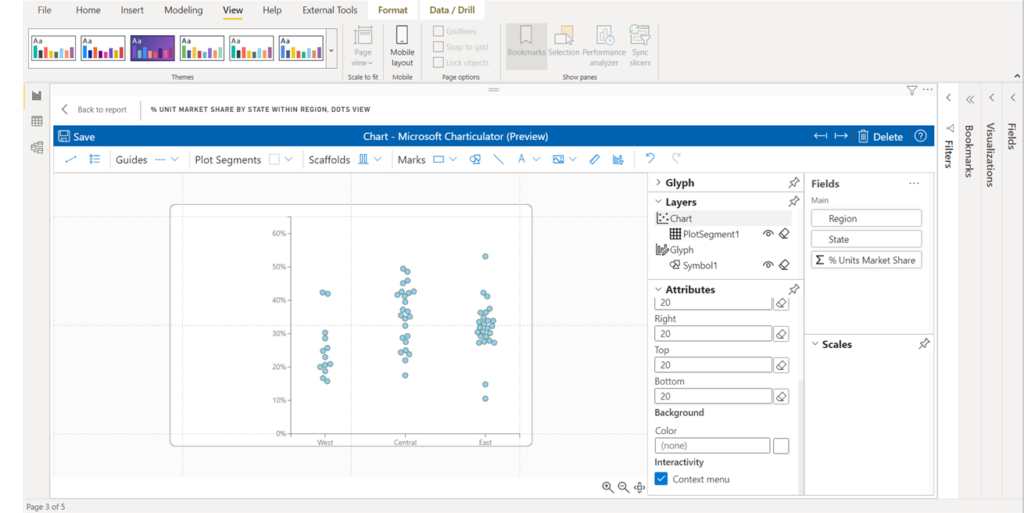
Harry has no trouble getting his data in there but soon finds himself stumbling around the somewhat bewildering user interface of Charticulator. This is not his first rodeo in the land of data viz but even Harry has trouble grasping what “glyph” really means and why he’s not getting the results he would intuitively expect. Recognizing the need for some guidance, Harry wisens up and follows along with a few of Burningsuit’s excellent Charticulator tutorials.

Everything soon starts to fall into place and Harry manages to create the exact chart his stakeholder asked for, all before lunch:
Best of all, it can cross-filter other visuals and behaves nearly identical to the standard Power BI visuals.
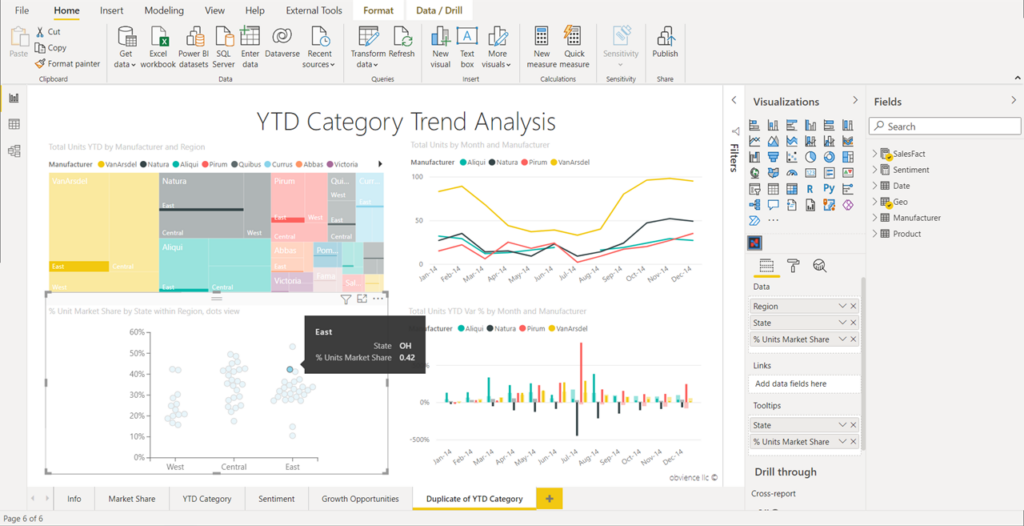
Harry seamlessly incorporates his shiny new visual into the Sales and Marketing report:
The requester is over the moon and Harry soon receives praise from other stakeholders saying they didn’t know how much they needed this until now. But Harry is astounded. How did he only now discover the marvel that is Charticulator? To spread the word, he makes up a silly short story about a Power BI developer stumbling upon it when investigating the feasability of a business request.