

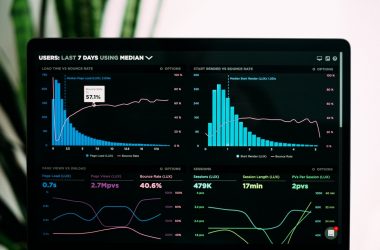
You maybe think: Creating dashboards is easy. But there is a difference between creating a single dashboard in a single style and creating several dashboards in the same style. For our client we were making Read more…
Month: May 2021
Self-Service Analytics, Just a Buzzword?
Introduction Self-service analytics (or self-service BI) is a concept that’s gained a lot of traction in the last decade. I’ve been told it will put me out of a job. I’ve also been told that Read more…

Spotfire Conditional Property Controls
Introduction If you’re using propery controls, it will sometimes make sense to limit the values that are displayed in each property control. Some examples include hierarchies like: Product Category – Subcategory US States – Cities Read more…

Tableau Containers
When I first started out using Tableau I was happy to see how easy it was to place my visuals onto the dashboard by using the floating option. It allowed me to drag my items Read more…
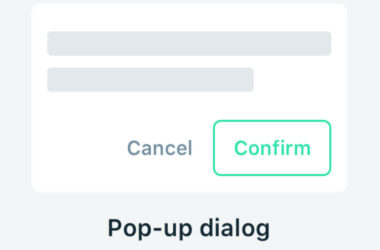
Adding a pop-up in TIBCO Spotfire
Introduction A pop-up window is usually a small window that opens in the foreground of the visual interface without the user selecting “New Window” from a program’s File menu. Pop-up menus provide quick access or Read more…
TIBCO Spotfire Bookmarks
Introduction A bookmark is a TIBCO Spotfire feature used to store the state of an analysis as a snapshot. For example, add a bookmark to your analysis would allow you to return to a state Read more…

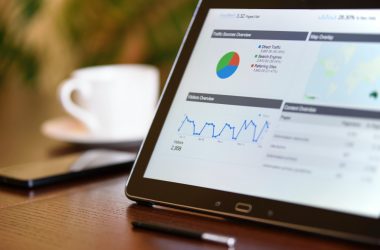
Dashboard design in TIBCO Spotfire
Introduction What is TIBCO Spotfire? The analytics tool allows users to combine data in a single analysis and get a holistic view of the same with an interactive visualization. TIBCO Spotfire software makes businesses smart, Read more…